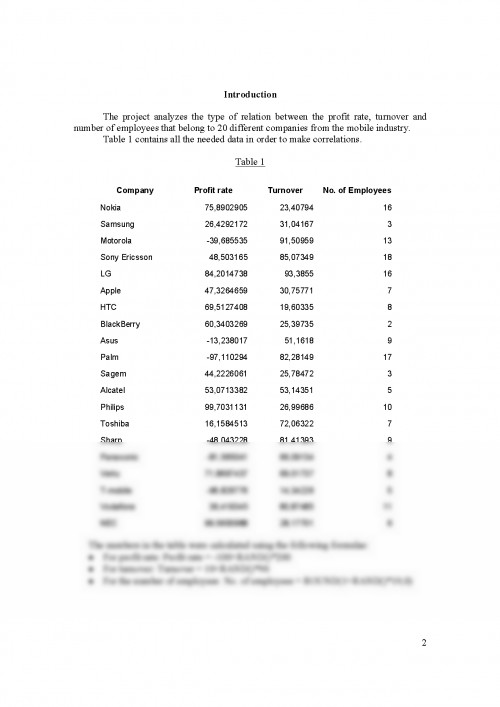

The project analyzes the type of relation between the profit rate, turnover and number of employees that belong to 20 different companies from the mobile industry.
Table 1 contains all the needed data in order to make correlations.
Table 1
Company Profit rate Turnover No. of Employees
Nokia 75,8902905 23,40794 16
Samsung 26,4292172 31,04167 3
Motorola -39,685535 91,50959 13
Sony Ericsson 48,503165 85,07349 18
LG 84,2014738 93,3855 16
Apple 47,3264659 30,75771 7
HTC 69,5127408 19,60335 8
BlackBerry 60,3403269 25,39735 2
Asus -13,238017 51,1618 9
Palm -97,110294 82,28149 17
Sagem 44,2226061 25,78472 3
Alcatel 53,0713382 53,14351 5
Philips 99,7031131 26,99686 10
Toshiba 16,1584513 72,06322 7
Sharp -48,043228 81,41393 9
Panasonic -81,565041 66,09134 4
Vertu 71,8697437 69,01737 8
T-mobile -96,826776 14,34226 5
Vodafone 36,419345 80,87485 11
NEC 99,5600988 28,17701 6
The numbers in the table were calculated using the following formulas:
- For profit rate: Profit rate = -100+RAND()*200
- For turnover: Turnover = 10+RAND()*90
- For the number of employees: No. of employees = ROUND(1+RAND()*19;0)
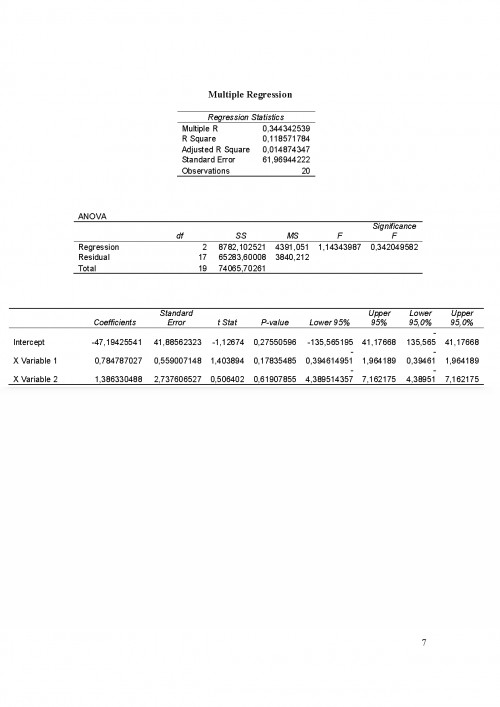
Simple Regression
In order to calculate the simple regression it was used the Excel program. After generating the data base (shown in Table 1) it was used the Data Analysis Tool Pack. The steps were the following: Tools ? Data Analysis ? Regression.
In order to obtain a simple regression, there were selected the data from the profit rate column for Y Range and the data from the number of employees column for X Range.
The summary output is the following:
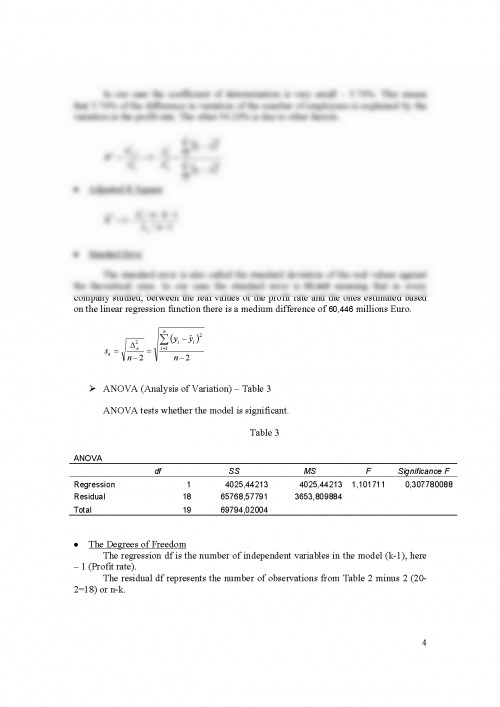
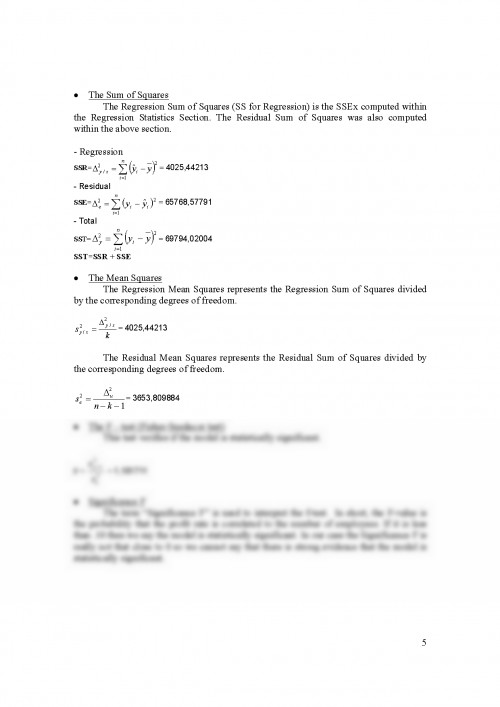
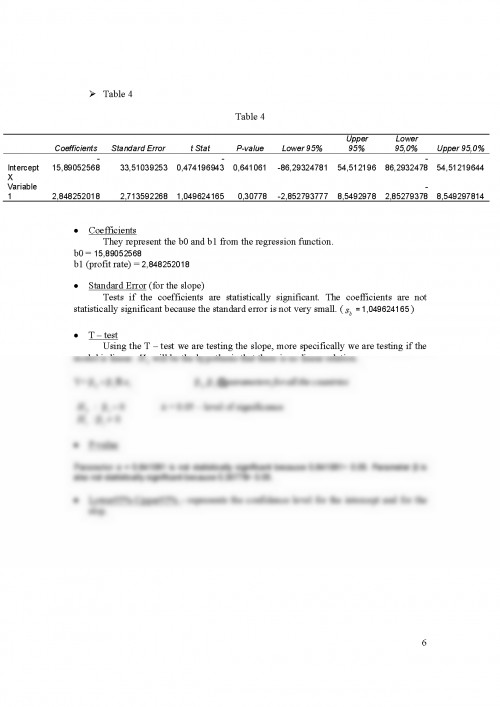
- Regression statistics table - Table 2
Table 2
Regression Statistics
Multiple R 0,240158348
R Square 0,057676032
Adjusted R Square 0,0053247
Standard Error 60,44675247
Observations 20
- Multiple R
The most important number here is "Multiple R" - coefficient of correlation - which has the value of 0.240. Multiple R is always between 0 and 1, and closer to 1 indicates stronger relation. iI
In this case being really close to 0, implies that we can conclude that the profit rate and the number of employees are not very close related. In other words, if the value of "Multiple R" in the "Regression Statistics" is close to 0, then the least-square regression line doesn't fit the data points pretty well, and there is not a linear relation between the two variables.
Documentul este oferit gratuit,
trebuie doar să te autentifici in contul tău.