
The purpose of my research is to find out if there is a correlation between the value of the exports and the gross domestic product and if the economic growth of Romania is influenced by the values of the export. In order to find this, I used the values of the exported goods and services and the values of the GDP in the last 10 years.
Confidence intervals
A confidence interval gives an estimated range of values being calculated from a
given set of sample data. The level of confidence of the confidence interval would
indicate the probability that the confidence range captures this true population
parameter given a distribution of samples
A confidence interval gives an estimated range of values being calculated from a
given set of sample data. The level of confidence of the confidence interval would
indicate the probability that the confidence range captures this true population
parameter given a distribution of samples
A confidence interval provides an estimated range of values, which are calculated from the database. The confidence level is expressed as a percentage and represents how often the true percentage of the population who would pick an answer lies within the confidence interval. The confidence level is 95%.
The lower and the upper level are computed as following:
Lower level = mean - confidence level
Upper level = mean + confidence level
For the export of goods, the confidence level is 11,44 and the interval between the lower and upper levels is 28,78 - 51,67 which means that in 95% of cases, an increase with one percent in the Export of goods will increase the value of GDP with 28,78/year minimum and 51,67/year maximum.
For the export of services, the confidence level is 1,83 and the interval between the lower and the upper levels is 11,33 - 14,98 which means that in 95% of cases, an increase with one percent in Export of services will increase the value of GDP with 11,33/ year minimum and 14,98/year maximum.
A confidence interval gives an estimated range of values being calculated from a
given set of sample data. The level of confidence of the confidence interval would
indicate the probability that the confidence range captures this true population
parameter given a distribution of samples
Simple Regression Model
By applying the simple regression model, I can verify if there is an important correlation between the exports and the gross domestic product.
The object of my project is to establish in if the value of exports of goods and
services in our country in3uence the value of GDP. The purpose of my research is
to inves?gate the causality between export and economic growth in Romania,
because the nature of this rela?onship has been one of the most debated topics
in the recent years.
One of the reasons for this topic is the ques?on if strong economic performance is
in3uenced by the value of exports of goods and service. The determina?on of the
causal pa8ern between export and growth has important implica?ons for the
policy maker's decisions about the development strategies and policies to adopt.
The rela?onship of causality between export and economic growth is called
export-led growth and it assumes that the export is one of the key indicators of
growth, and it states that one of the most important ways to increase the
progress of a country is by increasing the exports.
The object of my project is to establish in if the value of exports of goods and
services in our country in3uence the value of GDP. The purpose of my research is
to inves?gate the causality between export and economic growth in Romania,
because the nature of this rela?onship has been one of the most debated topics
in the recent years.
One of the reasons for this topic is the ques?on if strong economic performance is
in3uenced by the value of exports of goods and service. The determina?on of the
causal pa8ern between export and growth has important implica?ons for the
policy maker's decisions about the development strategies and policies to adopt.
The rela?onship of causality between export and economic growth is called
export-led growth and it assumes that the export is one of the key indicators of
growth, and it states that one of the most important ways to increase the
progress of a country is by increasing the export
In the excel part of the project I used the simple regression model two times. In the first time, I used as variables the Export of goods and the GDP and in the second time, the Export of services and the GDP.
The export of goods will be the regressor, which means that it will be the independent variable, while the GDP will represent the dependent variable for a period of 10 years.
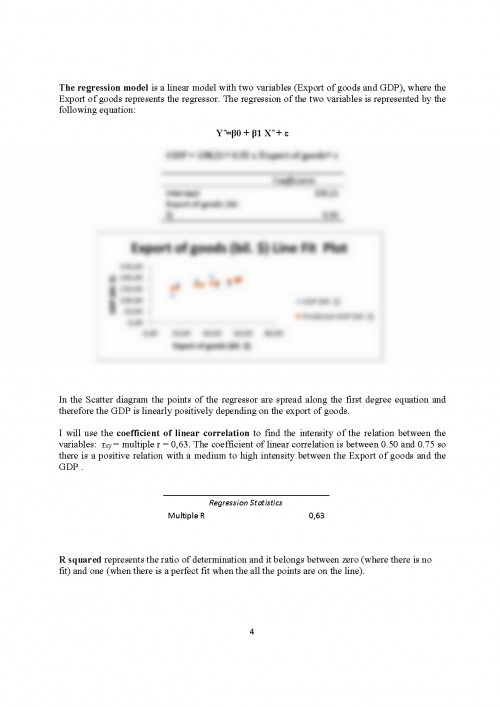
The regression model is a linear model with two variables (Export of goods and GDP), where the Export of goods represents the regressor. The regression of the two variables is represented by the following equation:
Y =?0 + ?1 X + ?
GDP = 138,21+ 0,92 x Export of goods+ ?
Coefficients
Intercept 138,21
Export of goods (bil. $) 0,92
In the Scatter diagram the points of the regressor are spread along the first degree equation and therefore the GDP is linearly positively depending on the export of goods.
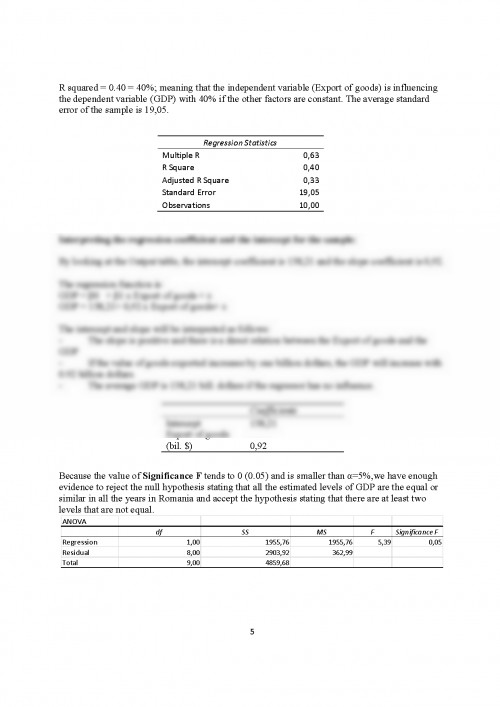
I will use the coefficient of linear correlation to find the intensity of the relation between the variables: rxy = multiple r = 0,63. The coefficient of linear correlation is between 0.50 and 0.75 so there is a positive relation with a medium to high intensity between the Export of goods and the GDP .
Pentru a descărca acest document,
trebuie să te autentifici in contul tău.